
Link-in-Bio Analytics: What to Measure and What It Means
Useful link in bio analytics answer three practical questions: did people reach the page, which destinations did they choose, and what should you change next? Start with page views, link clicks and click-through rate, then use top-link, source, device and country data to explain the pattern.
Belink's Stats view reports the last 30 days and compares the headline numbers with the previous 30-day period. It also shows up to five clicked links, traffic-source groups, device groups and leading countries. These are direction signals, not a complete record of sales, bookings or signups.
The safest operating rule is simple: read related metrics together, change one meaningful element at a time, and confirm the final outcome in the destination system. A button click proves that a handoff began; the shop, booking tool, form or newsletter platform must confirm whether it finished.
The answer first: read the dashboard in this order
Use this sequence so a large number does not distract from the customer journey.
| Question | Belink signal | What it can tell you | What it cannot prove |
|---|---|---|---|
| Did people arrive? | Page views | The page received visits in the selected 30-day window | Who was persuaded or whether every view was unique |
| Did they continue? | Link clicks | Visitors used tracked links | A purchase, booking or signup completed |
| How often did visits lead to clicks? | Click-through rate | Clicks divided by page views | Why someone clicked or did not click |
| What attracted attention? | Top links | Which tracked destinations received clicks | Whether the destination converted |
| Where and how did visits arrive? | Source, device and country | Broad context for the page-view pattern | A person's identity or intent |
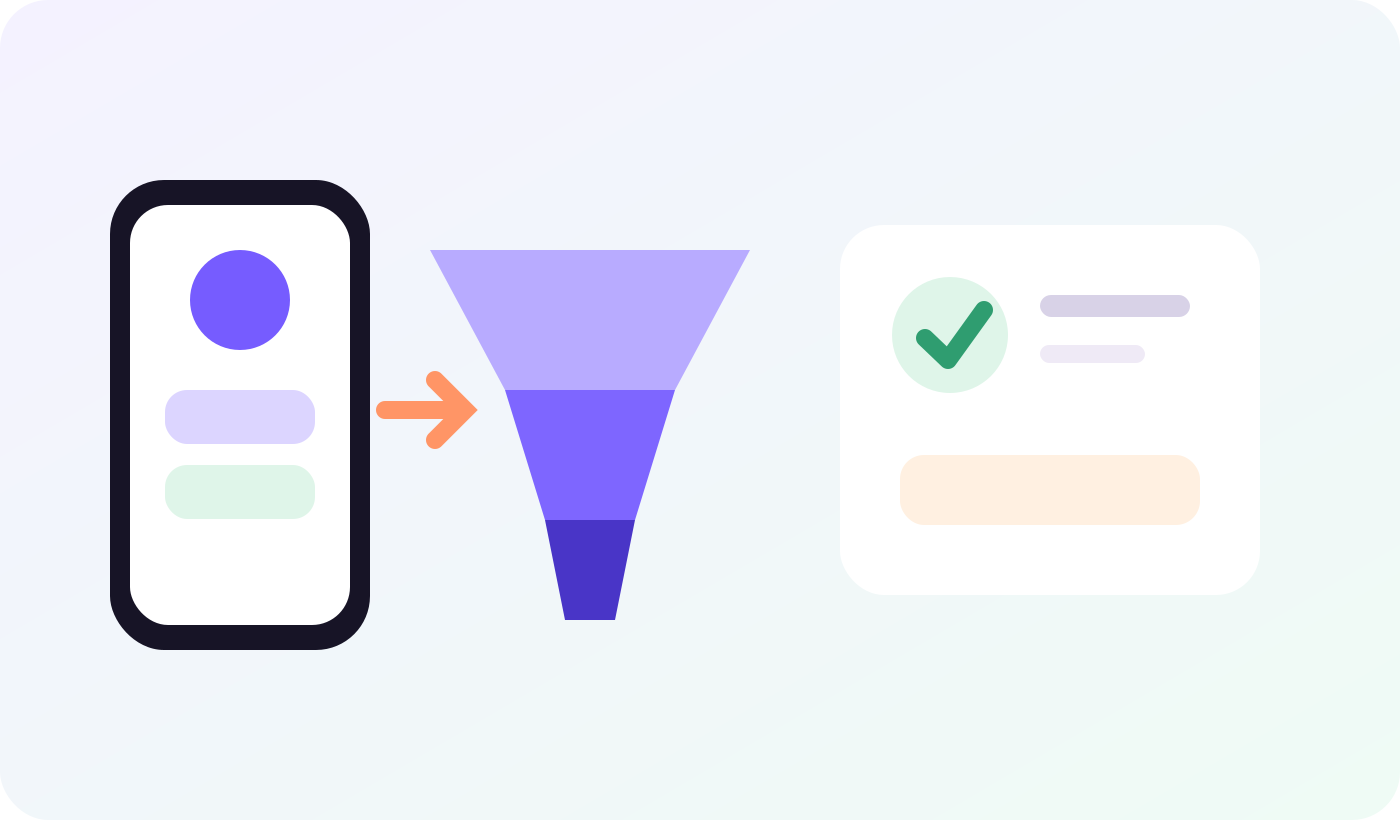
Read Belink's page views and clicks as stages in a journey; verify the business outcome in the destination system.
1. Start with page views, not clicks alone
Page views establish the size of the opportunity. If views fall sharply while the page has not changed, check whether the Belink URL is still present in every active social profile, pinned post, email signature or QR placement. Also check whether the current content actually tells people to use the bio link.
Compare the current 30-day total with the previous 30 days, but write down context before judging the difference. Posting frequency, a campaign launch, a viral video, a quiet holiday week or a broken profile link can all change traffic without saying anything about page quality.
A page-view increase is useful evidence that distribution improved. It is not evidence that the page's offer improved.
2. Pair link clicks with click-through rate
Link clicks show how often tracked links were used. Click-through rate adds proportion: Belink calculates it as link clicks divided by page views. If a page records 120 views and 30 clicks, the displayed rate is 25%.
Treat that rate as a navigation signal. It helps compare two periods on the same page, but it is not a universal score. A page built around one urgent booking action may behave differently from a creator page that lets fans browse videos, documents and social profiles.
Multiple clicks can also come from one visit. The ratio describes recorded actions, not a count of people who converted. Never label it a sales conversion rate unless the destination system uses the same denominator and confirms completed sales.
3. Use top links to test the page hierarchy
Belink's Stats view ranks up to five links that have received clicks. Compare that order with the order and emphasis on the public page.
If the first button is supposed to be the main action but a lower link receives more attention, investigate before rearranging everything. The lower label may be clearer, the offer may be more relevant, or a recent post may have promised that destination specifically. The guide to clearer call-to-action buttons can help separate label problems from offer problems.
For every leading link, record:
- its current page position and exact label;
- the social post or profile promise that sends people there;
- the destination headline and final action;
- clicks in the current window and the previous window;
- destination-side outcomes for the same dates.
This short ledger turns a leaderboard into an editorial decision.
4. Add source, device and country context
Traffic-source groups help you see which referrers are associated with page views. Direct or unknown traffic is normal: in-app browsers, privacy controls, copied URLs and untagged placements can remove or blur referral information. Do not force an attribution story from an incomplete source label.
Device data tells you whether visitors mainly arrive on mobile, desktop or another broad device group. Use it to prioritize testing. If mobile dominates, open the public page inside the social app, use mobile data and follow every important route. The link-in-bio launch checklist provides a repeatable signed-out phone test.
Country data is best used for operational questions such as language, delivery regions, event times and support coverage. It should not be used to infer personal identity or individual intent.
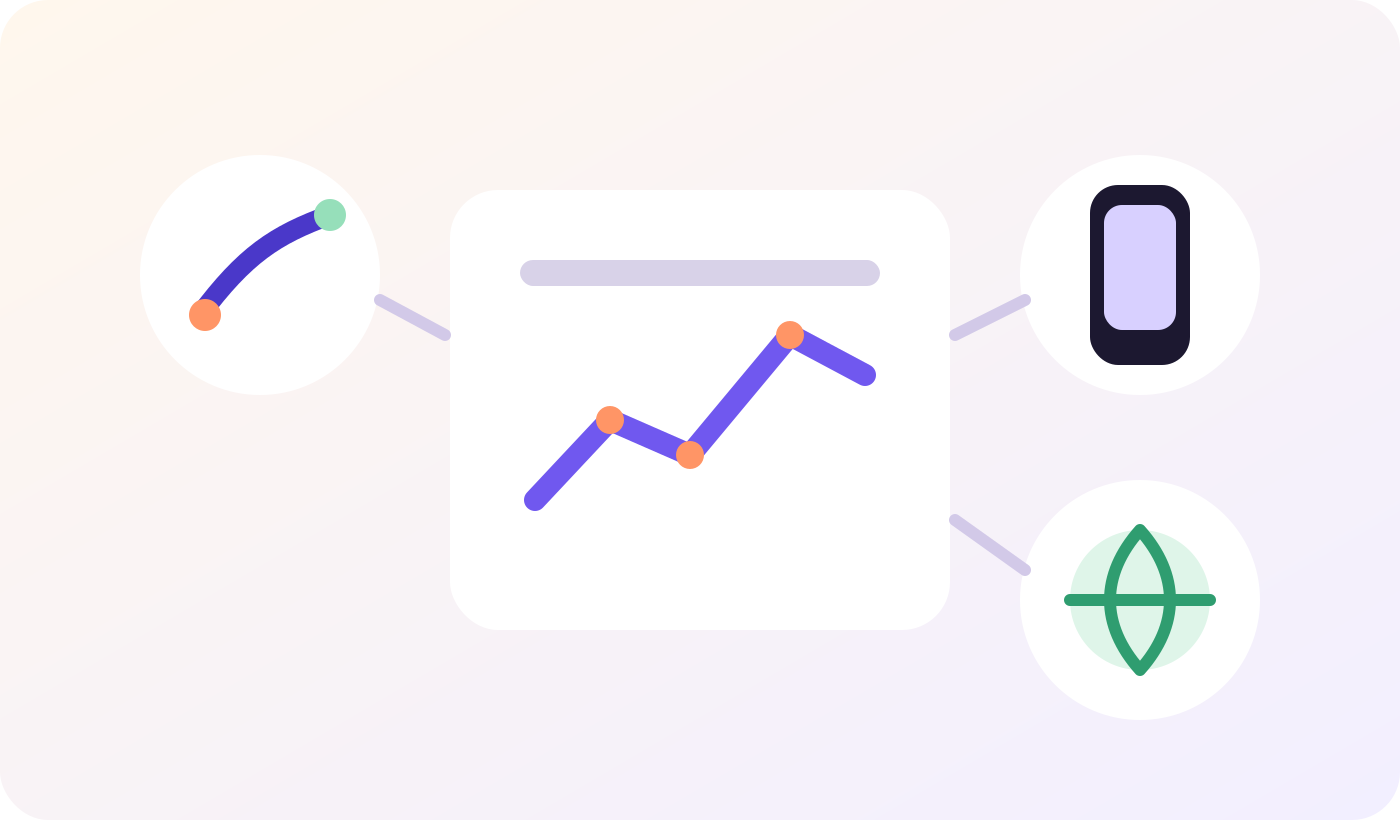
Source, device and country data explain the conditions around a visit; they do not identify a person or prove a business result.
5. Diagnose the pattern before changing the page
Four common patterns lead to different actions.
Views up, click-through rate steady
Distribution probably improved while the page continued to guide visitors at roughly the same rate. Confirm that the additional clicks reached the right destination, then inspect destination outcomes before declaring the campaign successful.
Views up, click-through rate down
The new audience may have weaker intent, the social promise may not match the first button, or the page may offer too many equally prominent choices. Check the exact posts that drove traffic and the first screen visitors saw.
Views steady, clicks up
A clearer label, stronger offer or better ordering may be helping. Preserve a dated note of the change and wait for enough traffic before making another major edit.
Views and clicks both down
First check distribution and availability: profile placement, expired campaigns, broken URLs, unpublished pages and quiet posting periods. Redesign is not the first response to a traffic-source problem.
6. Run a 30-day review that produces one decision
A useful review can fit on one page:
- Record current and previous page views, clicks and click-through rate.
- List the top five links with their labels, positions and destination outcomes.
- Note the leading source, device and country patterns.
- Add campaign dates, publishing changes, outages and expired offers.
- Choose one change, one owner and one review date.
Good single changes include rewriting one vague button, moving one current offer, removing one expired route or aligning one social post with its promised destination. Avoid changing the theme, order, labels and offer simultaneously; you will not know which change influenced the next pattern.
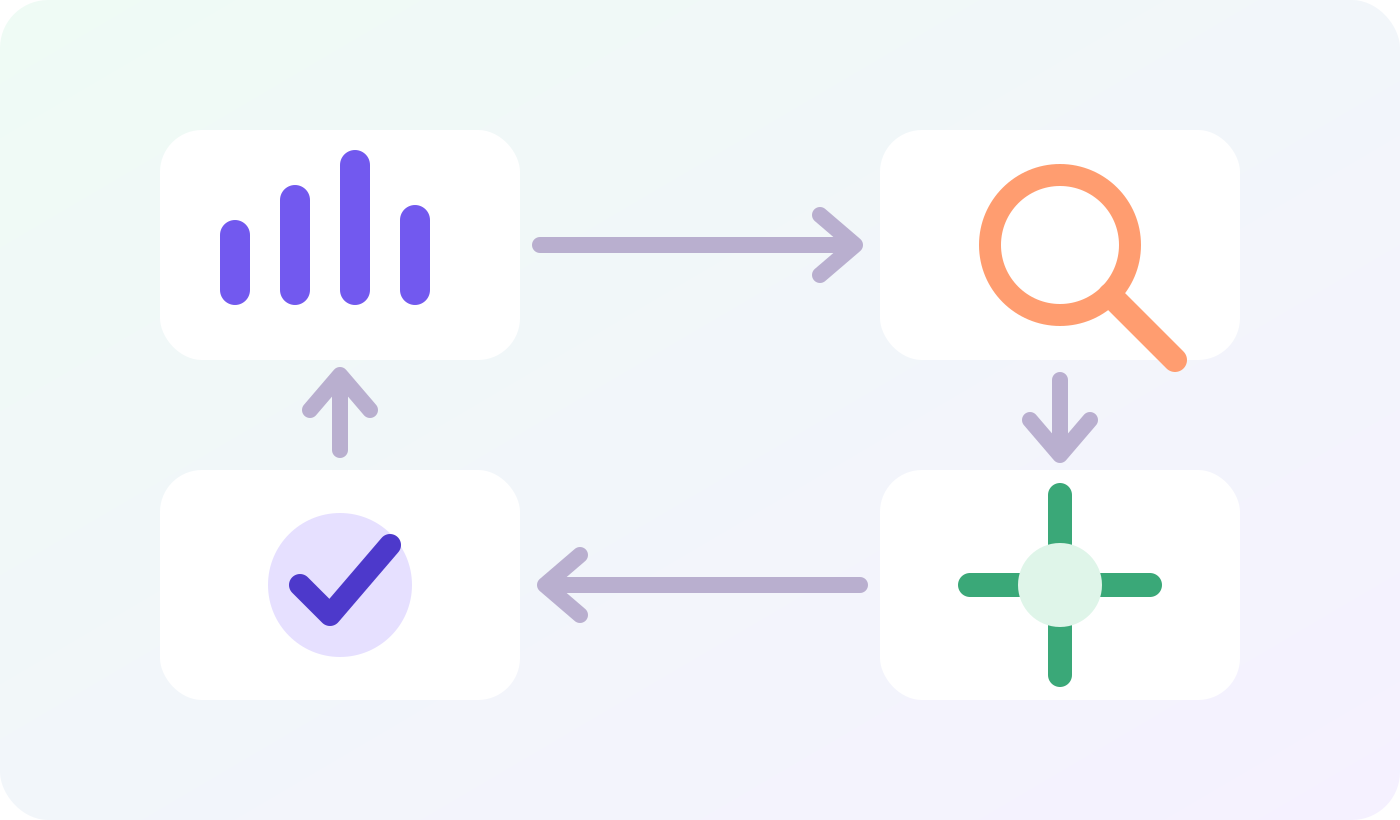
A disciplined review closes the loop: measure, diagnose, change one thing, then verify the full destination journey.
7. Keep a measurement boundary
Belink records activity on the bio page and tracked link handoffs. A shop, payment processor, booking service or form records what happens after the visitor leaves. Connect the two with matching date ranges and a small campaign log rather than assuming one dashboard contains the whole journey.
For example, if “Book a consultation” receives 40 clicks, compare that period with completed bookings in the calendar system. Investigate abandoned forms, unavailable times and mobile friction. Report “40 link clicks and 9 completed bookings,” not “49 conversions” and not “40 bookings.”
Also avoid false precision when traffic is small. One extra click can create a dramatic percentage change from a tiny baseline. Show the underlying totals beside every percentage.
A practical weekly note
Between formal 30-day reviews, keep a short weekly note with the active offer, first button, major distribution channels, incidents and unusual traffic. This makes the later comparison explainable without encouraging constant page changes.
The objective is not to maximize every number. It is to help the right visitor reach a useful destination, notice when that journey breaks, and make the next change with evidence.
Frequently asked questions
What does Belink count as click-through rate?
Belink's Stats view calculates click-through rate as recorded link clicks divided by recorded page views for the current 30-day window. It is a page-navigation ratio, not automatically a sales or lead conversion rate.
Can link clicks tell me how many sales I made?
No. A link click confirms a tracked handoff from the Belink page. Use the destination shop, booking, payment or form system to verify completed outcomes over the same dates.
Why does traffic-source data sometimes show direct or unknown visits?
Referral information can be missing when someone types or pastes a URL, uses an in-app browser, crosses privacy controls or opens an untagged placement. Treat source groups as directional context rather than perfect attribution.
How often should I change my link-in-bio page?
Change it when an offer, destination or visitor need changes—not every time a daily number moves. Use a 30-day comparison for strategic review and schedule immediate checks for launches, broken links and expired campaigns.
Which analytics number should I watch first?
Start with the journey: page views for arrival, clicks and click-through rate for the handoff, top links for choice, and destination outcomes for completion. No single metric explains the whole result.